2.10.2 Websphere Message Broker & IBM Integration Bus Monitoring and Statistics
In this post we would like to demonstrate how easy it is to setup monitoring and statistics collection in Qflex for IBM Websphere Message Broker and Integration Bus v9 and up. Note that we assume you already have broker Queue Manager already setup in Qflex and that JMS provider is enabled
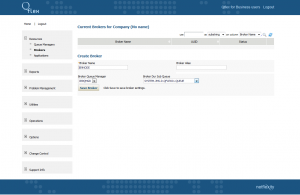
Connect to Message Broker
Let’s select broker’s queue manager and dedicated JMS queue for Qflex to collect all communication from broker.
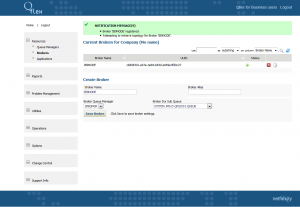
Once you created connection to broker you will see confirmation screen below.
Create Subscriptions
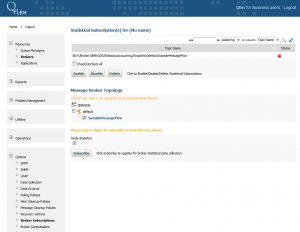
Now you can navigate into topology to see all your execution groups and flows.
Select the level of monitoring that you would like to perform. We suggest select the most detailed/specific part of taxonomy to reduce stress on underlying IBM Websphere Message Broker/ Integration Bus. In the example below we select sample message flow.
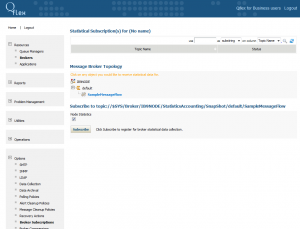
Select desired message broker/integration bus, execution group or message flow and click “Subscribe” button.
Subscription is now created within Qflex but not activated in the IBM Message Broker/Integration Bus, so select the subscription and press “Enable” button to activate it.
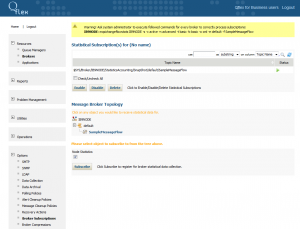
At this point the subscription is enabled within the broker and Qflex has started collecting various broker statistics in its data storage. At this point Qflex is ready to perform monitoring of message broker, it’s message flows and nodes. In addition, Qflex will allow execution of various statistical reports. Note that data is preserved forever but can be configured to compress some statistics to save space.
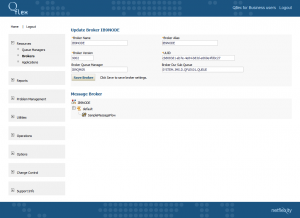
Monitor Message Broker
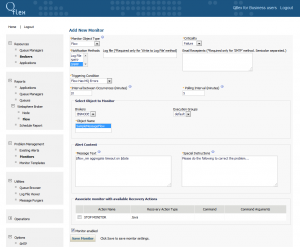
As an example, we will create a monitor that will check if a particular message flow generated any errors during execution. Other monitor types available for IBM Message Brokers/IIB, message flows and nodes. Check documentation for more information.
Message Broker Reporting
Now, let’s play with statistical reporting features. Here we are trying to see node report for the past 10 hours. Note that this report can be scheduled to run daily or at any interval and be emailed as PDF as well.
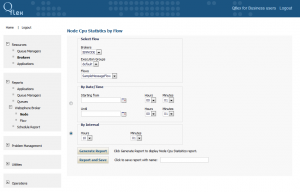
As a result we get below.
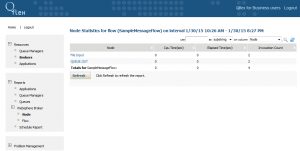
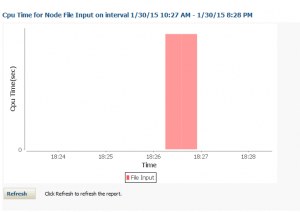
At this point we can drill into particular nodes to see more charts and detailed data breakdown.
As an example, let’s also run message flow report.
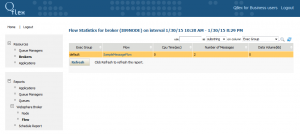
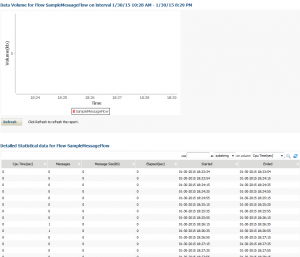
As with nodes, we can drill into detailed message flow view.
This concludes this presentation. For more information or comments, please contact as at customers@netflexity.com