
3.1.2 Message Distribution
To see chart of message distribution for a specific Application over the last 24 hours click on Dashboard and select from expanded menu message distribution:

In the left part of the page you will see a graph in form of Pie Chart with legend, and in the right - explanatory table:
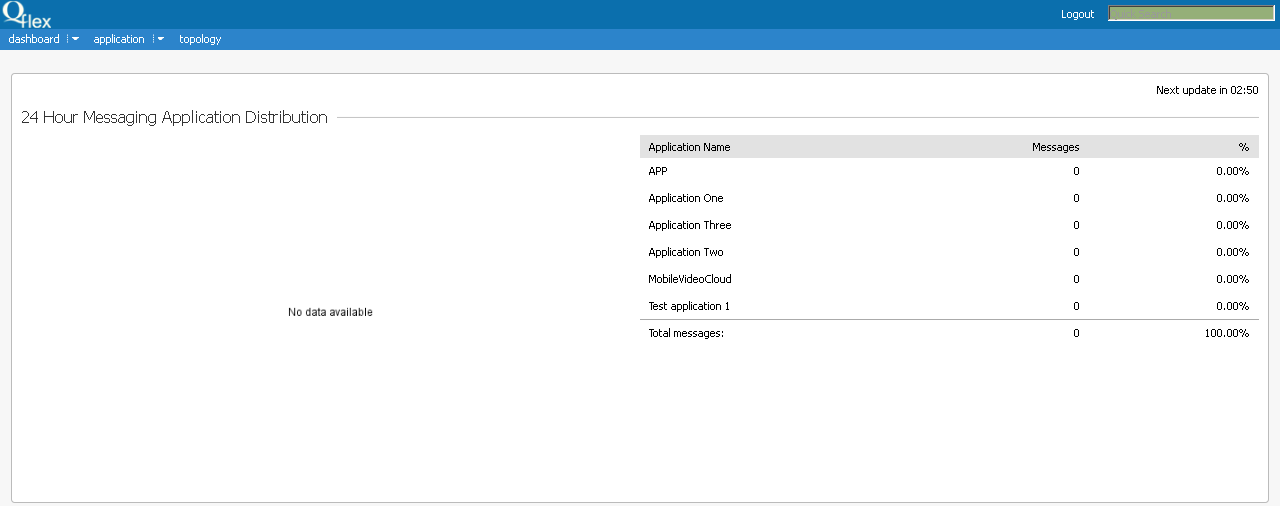
The table shows exact number of messages, percentage to total number and total number of messages.
Message distribution page is automatically updated each 3 minutes. In the upper right corner there is a counter showing remaining time until the next update:
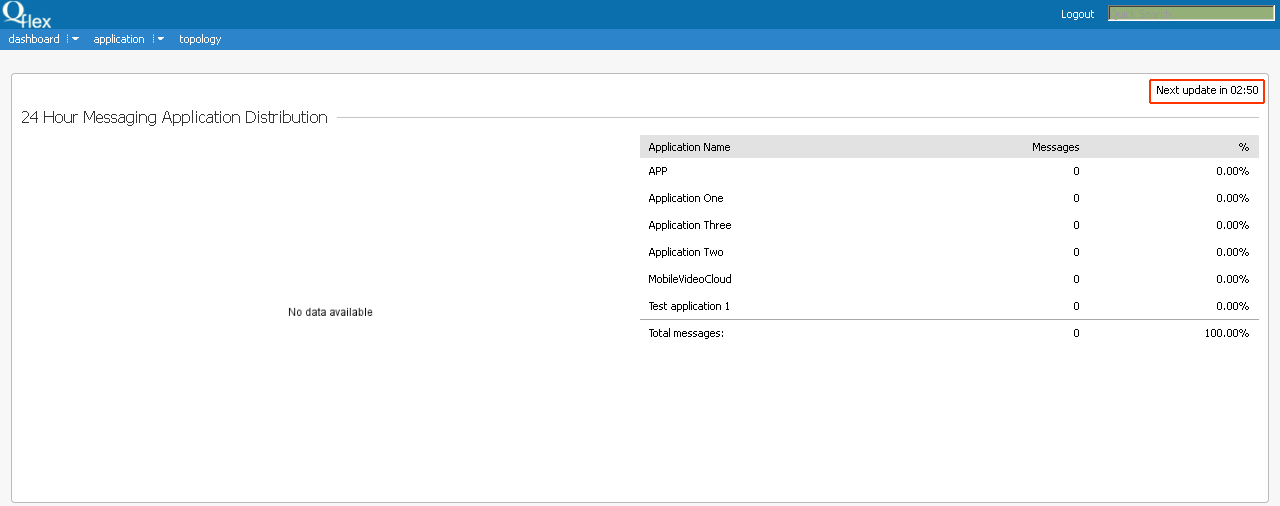
Click on the time counter to update it manually.