
3.3.2 Topology display options
1. Topology is shown as a graph where nodes represent QManagers and links between them - Channels:
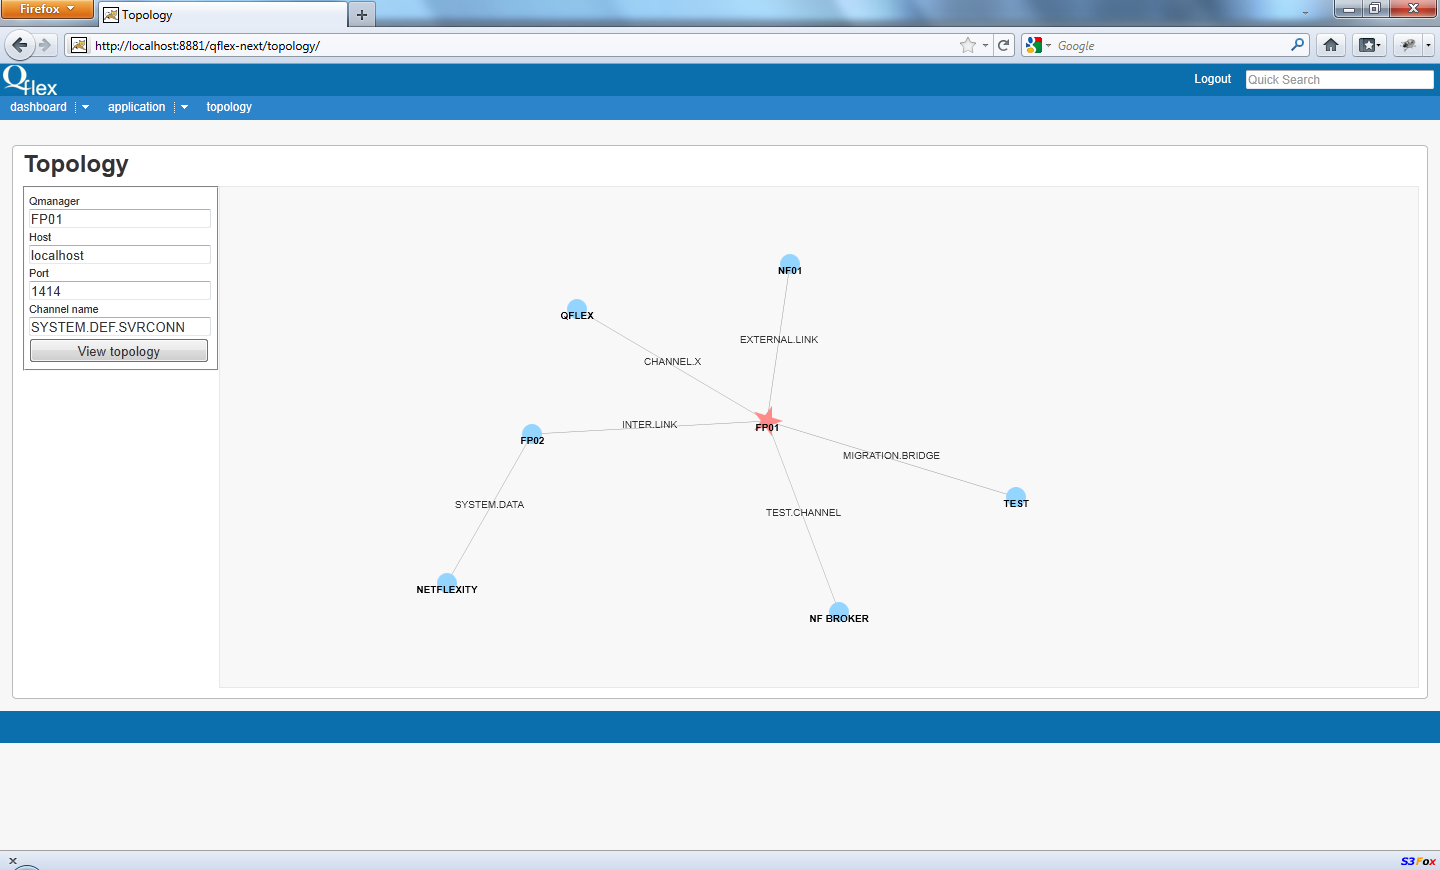
2. QManager that was used as a starting point for search is represented by a star, other QManagers are marked by circles. Drawing algorithm is distributing the nodes in most optimal way.
3. If needed you can drag and drop the nodes to change automatic order.
4. Move mouse wheel to change the topology scale.
Note
Depending on configuration of the scanned network the scanning process can take some time.